In the first part, I described the potential interest of using Hadoop for Value At Risk calculation in order to analyze intermediate results. In the three (2,3, 4) next parts I have detailled how to implement the VAR calculation with Hadoop. Then in the fifth part, I have studied how to analyse the intermediate results with Hive. I will finally give you now some performance figures on Hadoop and compare them with GridGain ones. According to those figures, I will detail some performance key points by using such kind of tools. Finally, I will conclude why Hadoop is an interesting choice for such kind of computation.
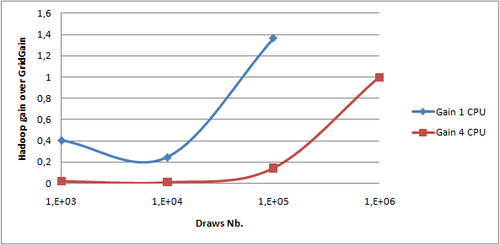
With that implementation it is now possible to grab some performance measures. I used a virtual machine with 2 GB RAM and 4 cores on my laptop, a DELL Latitude E6510 with a core i7 quad core and 4 GB of RAM. Indeed, Hadoop is easier to install on Linux bearing in mind I'm using Windows for my day to day work. Performance comparison cannot be made directly with previous measures taken on a physical machine. So I replayed the GridGain run in which all results are stored on disk on the virtual machine. I have done the measures with 1 and then 4 CPUs. The following graph clearly shows the gain of using Hadoop in both cases: 
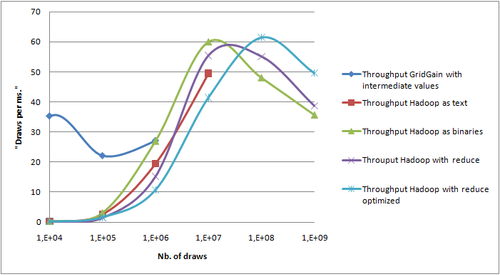
For large volume of data, I could not do performance measures with GridGain due to my 32 bits architecture which limits my heap size. However, beginning with 100,000 draws we can see that Hadoop is as quick as GridGain. So my next step will be to analyze performance for larger volumes of data with the two implementations I have described and some optimizations.
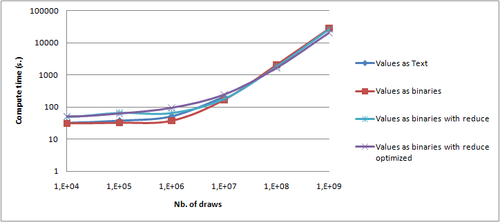
Values are written in a text for or in a binary form.
The VAR is extracted by the main() function or by the reduce phase
Some configuration parameters have been tuned as described below:
#core-site.xml
io.file.buffer.size=131072
#hdfs-site.xml
dfs.block.size=134217728
#mapred-site.xml
mapred.child.java.opts=-Xmx384m
io.sort.mb=250
io.sort.factor=100
mapred.inmem.merge.threshold=0.1
mapred.job.reduce.input.buffer=0.9
In brief, it allows having a bigger heap (mapred.child.java.opts), processing larger batch in memory before going to disk (io.file.buffer.size, io.sort.mb, io.sort.factor, mapred.inmem.merge.threshold, mapred.job.reduce.input.buffer) and reading/writing larger blocks on HDFS (dfs.block.size).


Hadoop is able to perform distributed Value At Risk calculation. It cannot compete directly with tools like GridGain as it has been designed to process large volumes of data on disk. However, in the case of VAR calculation with further analysis of all intermediate results, it does indeed provide a better framework. First, optimized file system distribution and job distribution in a colocalized way provides out of the box a very good scalability (up to 1,000,000,000 draws, 15.4 GB of compressed binary data on a single laptop). Then, being able to do BI directly on the file system removes a lot of transfer costs for large volume of data. From a developer point of view, Hadoop implements the same map/reduce pattern as GridGain. However, code has to be designed with Hadoop distribution mechanism to be really efficient. Performing financial computing on Hadoop can still be considered today as an R&D subject as the tools are still very young. Distribution for computer intensive tasks is used for about 10 years in Corporate and Investment banks. Benefiting from distribution on storages has allowed big internet actors to process huge volumes of data due to reasonable storage and processing costs that were not affordable with big and monolithic systems. Different initiatives around distributed storage and data processing - with the NoSQL movement - show that more and more integrated tools are currently in development. Such architectures can both help solving particular problems that do not fit very well with traditional approach or allow new data analysis in use cases where processing TB of data was a limitation with traditional architectures.