After introducing the Value at Risk in my first article, I have implemented it using GridGain in my second article. I conclude in this latter that relatively good performances have been reached through some optimizations. One of them was based on the hypothesis that the intermediate results - the prices for each draw - can be discarded. However, it is not always the case. Keeping the generated parameters and the call price for each draw can be very useful for business in order to analyze the influence of the different parameters. Such data are often crunched by Business Intelligence. VAR calculation is maybe not the best business use case in order to illustrate that need but I will reuse it as it has already been defined. The purpose of this new series of articles will be to compute the Value at Risk and keep all results, to be able to analyze them.
In these articles, some portions of the code were removed when nothing was changed since the last article and replaced by comment (//Unchanged...).
The easiest way to do it is by modifying the current implementation. I created for that purpose a Result class holding parameters and price for each draw. It implements Serializable to be easily stored on the disk and comparable in order for it to be sorted like the price.
public class Result implements Serializable, Comparable<result> {
	private final Parameters parameters;
	private final double price;
	//Constructor, getters, compareTo(), equals(), hashCode(), toString() implementations...
}
computeVar() signature is modified accordingly.
public SortedSet<result> computeVar(...) throws MathException {
		//Unchanged...
		for (int i = 0; i < drawsNb; i++) {
			//Unchanged....
			final Result result = new Result(new Parameters(optionPricer.getParameters()),price);
			// For each draw, put the price in the sorted set
			smallerPrices.add(result);
			if(configuration.isCombineAllowed()) {
			//Unchanged...
			}
		}
		return smallerPrices;
}
Finally the results are written to disk by calling FilePersistenceManager.writeToDisk() which basically delegates to an ObjectOutputStream plugged to the disk.
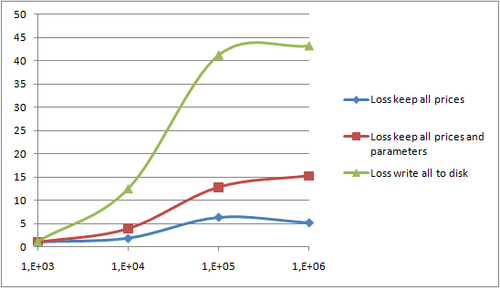
Some measures, on the same laptop, show performance drawbacks as expected:
Result objects is bigger than a collection of simple double. In fact, on my 32 bits machine, I wasn't able to generate more than 1,000,000 results.Result objectsThe following graph shows the loss of storing the intermediate results defined like hereunder, thru different scenarios

Hadoop, an Apache project self-defines itself as an open-source software for reliable, scalable, distributed computing. According to Wikipedia it enables applications to work with thousands of nodes and petabytes of data. In brief, it is a tool employed by Yahoo to process huge volume of data. It's architecture was inspired by Google MapReduce and Distributed File System. I will not describe it any further. Please refer to and refers to this article for additional information.
I decided to implement this VAR calculation on Hadoop for 3 reasons:
More specifically, "NoSQL" architectures are well suited for BI analysis. So I wanted to see if it would be possible to combine the two functions in one tool. One of the advantage would be to limit the quantity of data moved back and forth. For that purpose I used both Hadoop for map/reduce and Hive for data analysis. Hive is a kind of simplistic warehousing system built on top of Hadoop. In practice, it provides a DSL very close to SQL, which is translated by Hive into map/reduce actions. I will refer you to that article for Hive installation details.
Hadoop and Hive are systems based on file manipulation (keep in mind they are based on a distributed file system). Hadoop consists in a Distributed File System, which enables to share code and data between nodes, and a bunch of jobs, divided into map and reduce tasks, coordinated by Hadoop framework. So Hadoop provides out of the box:
Hadoop processes files. I have written the following input file.
1;252;120.0;120.0;0.05;0.2;0.15;1000;0.99;250
1;252;120.0;120.0;0.05;0.2;0.15;1000;0.99;250
1;252;120.0;120.0;0.05;0.2;0.15;1000;0.99;250
1;252;120.0;120.0;0.05;0.2;0.15;1000;0.99;250
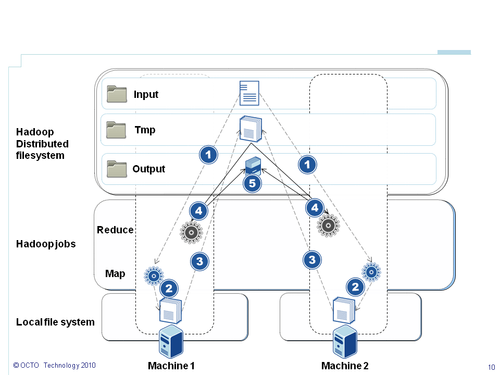
Each line means: Compute 250 draws of the call price with the following parameters (t=252 days, s0=120€, k=120€, r=0.05%, sigma=0.2, historicalVolatility=0.15) for scenario 1. The goal is to compute 1% VAR (0.99) on 1000 draws. Please refer to my previous article for an explanation about that parameters. The process of a Hadoop job is as follow. The number corresponds to the labels on the schema and are sorted in chronological order: 
NLineInputFormat, described in a next part of that serie) meaning that each line will be send to a map slot);map phase and prices are computed. Results are temporarily stored on the local file system. The output format will be key-value as described hereafter;reduce task. For the purpose of that first implementation I didn't use the reduce side as we will see in the next part;So, the implementation with GridGain has shown that storing all results of disk have performance impact. Hadoop is a different tool. It is less optimized for computing intensive task but provides an efficient framework for distributing processing of large data. It's implementation of the map/reduce pattern is quite different from GridGain and needs some adaptation of the way to compute the VAR. We will discuss in the next part the detailed implementation of the VAR calculation with Hadoop. The next three parts will be focused on coding and implementation details. If you are only a bit interested in technical details, you can skip these parts in first read and wait for the 4th part in which I will describe how to analyse the intermediate values.